
POL04 · Political Marketing
Web & Social Media Tester
Which digital content stops the eye, holds attention and makes the campaign message stand out?
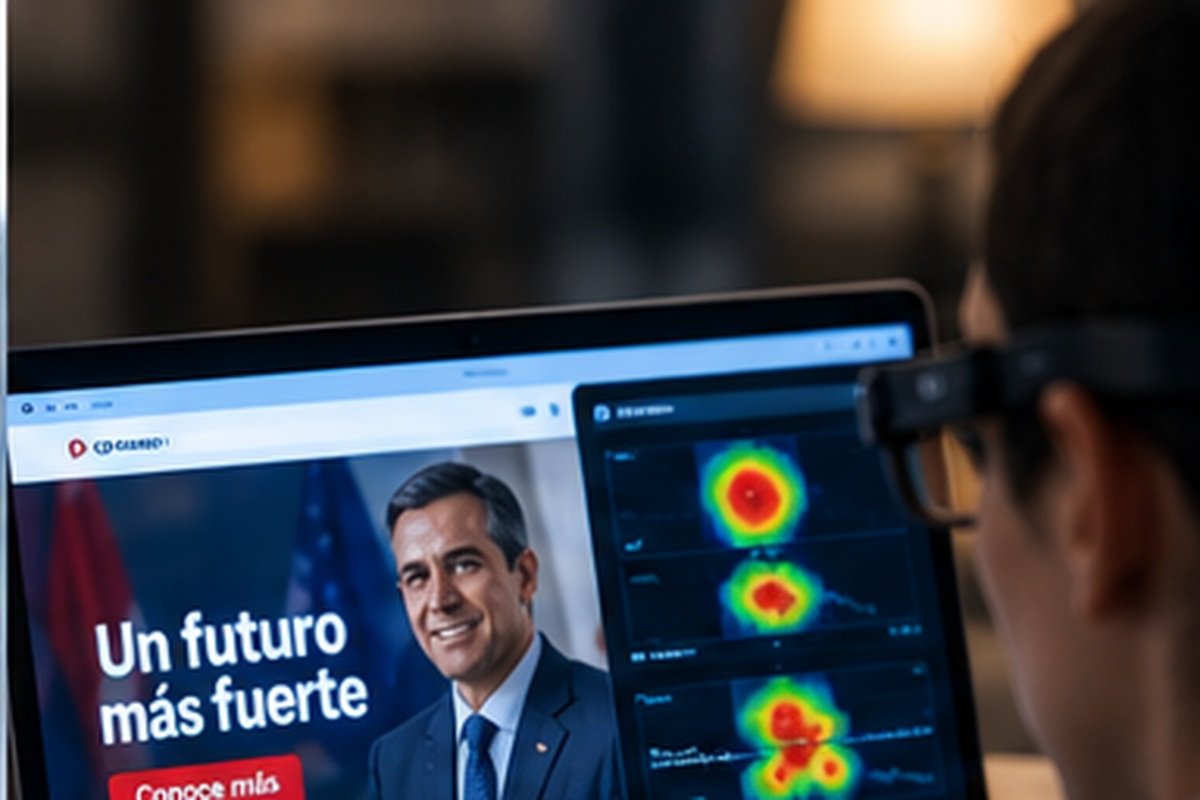
Research protocolWeb & Social Media Tester
Which digital content stops the eye, holds attention and makes the campaign message stand out?
Political MarketingOnline Eye TrackingEye Tracking BarSocial MediaWebPolitical
FIELDPolitical Marketing
EXECUTIONOnline or in-person execution
TECHNOLOGY PATHOnline Eye Tracking · Eye Tracking Bar
STUDY CODEPOL04
The research question
Which digital content stops the eye, holds attention and makes the campaign message stand out?
Web & Social Media Tester measures visual attention across political websites, landing pages, ads, posts, reels, stories, banners and other digital content. The service uses eye tracking only, with online measurement for Basic and Eye Tracker Bar for Advanced.
OnlineControlled in-person desktop evaluation
Technology configuration
Measurement follows the task
The technology path shown here is the approved structure for this service. The exact protocol is configured around the research question, environment and participant flow.
Typical protocol · Political Marketing
How this study is executed.
The protocol below reflects the service definition developed for Neuro Garage. Final details are confirmed before execution.
Define the digital assets, pages, posts or creatives and the critical visual elements.
Expose participants using Online Eye Tracking or Eye Tracking Bar.
Measure first fixation, fixation count / duration, viewing time, attention distribution and visual sequence.
Identify candidate, message, slogan and CTA visibility together with ignored elements, blind spots and attention drop-off.
Report comparative visual-attention performance across the tested digital content.
Typical outputs
What this specific study can produce
01Heatmap
02Gaze Plot
03Time to First Fixation
04Fixation Count
05Fixation Duration
06Total Viewing Time
07Attention Distribution
08Visual Sequence
09Areas of Interest Performance
10Scroll / Content Attention
11Candidate Visibility
12Message Visibility
13Slogan Visibility
14CTA Visibility
15Ignored Elements
16Visual Blind Spots
17Attention Drop-off
18Version Comparison
Decisions supported
What the client can change with the evidence
The study is designed to translate observed behavior into concrete operational, people, design or risk-management decisions.
Industry references / comparable applications
Who has used comparable research approaches?
Publicly documented examples from companies and institutions worldwide. These organizations are not presented as Neuro Garage clients, and the examples do not imply they purchased this exact Neuro Garage protocol.
01


UnileverPublic precedent
Shopper and packaging research using eye tracking to understand attention and package performance.
View public source ↗02Toyota CanadaPublic precedent
Showroom shopper research to understand buyer attention and the purchase journey.
View public source ↗03Procter & GamblePublic precedent
Documented user of consumer-research eye tracking for product and media behavior studies.
View public source ↗Scientific configuration
The method follows the question
Technology is selected because it is scientifically appropriate for the research objective, not because a device must be used. Santiago configures the study scope, stimuli, participant flow and measurement path before execution.
Discuss this study